
Olla v0.0.29 is the biggest release so far. It ships an embedded, read-only admin dashboard so you can see your whole inference fleet at a glance, a native Prometheus metrics endpoint, and a long list of routing, configuration and security fixes that came out of running Olla in anger.
The new admin dashboard
Olla now serves a read-only dashboard at /internal/ui/, from the same
listener as the proxy. No second port, no sidecar, no external exporter. It polls the
existing /internal/status* JSON, so it only ever shows you what Olla
already knows.
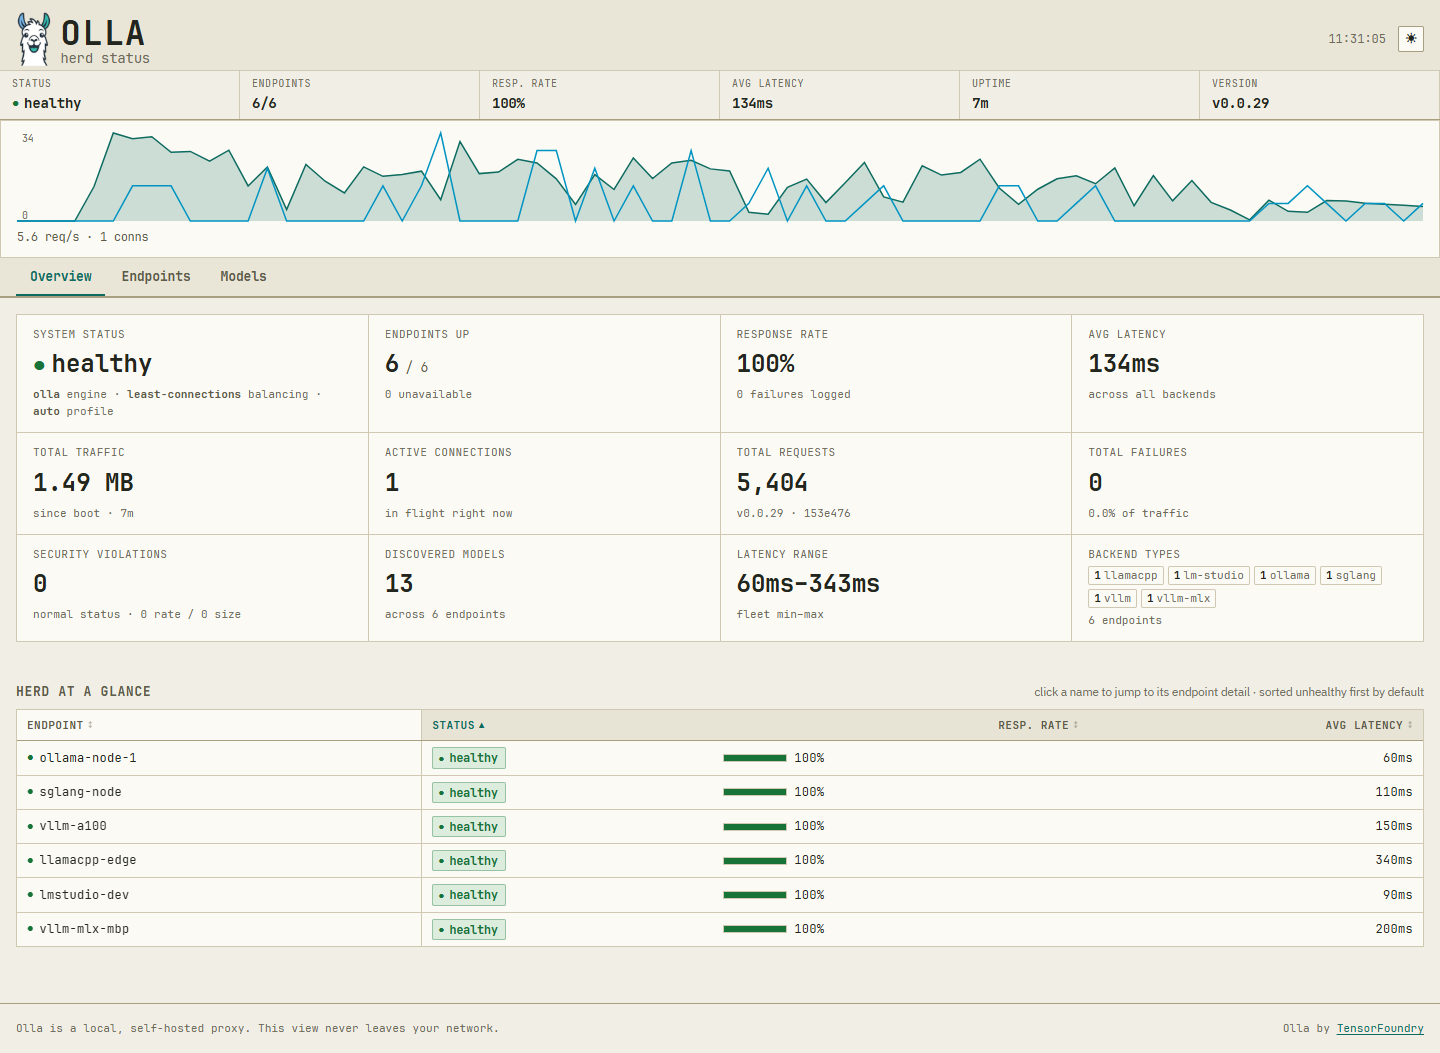
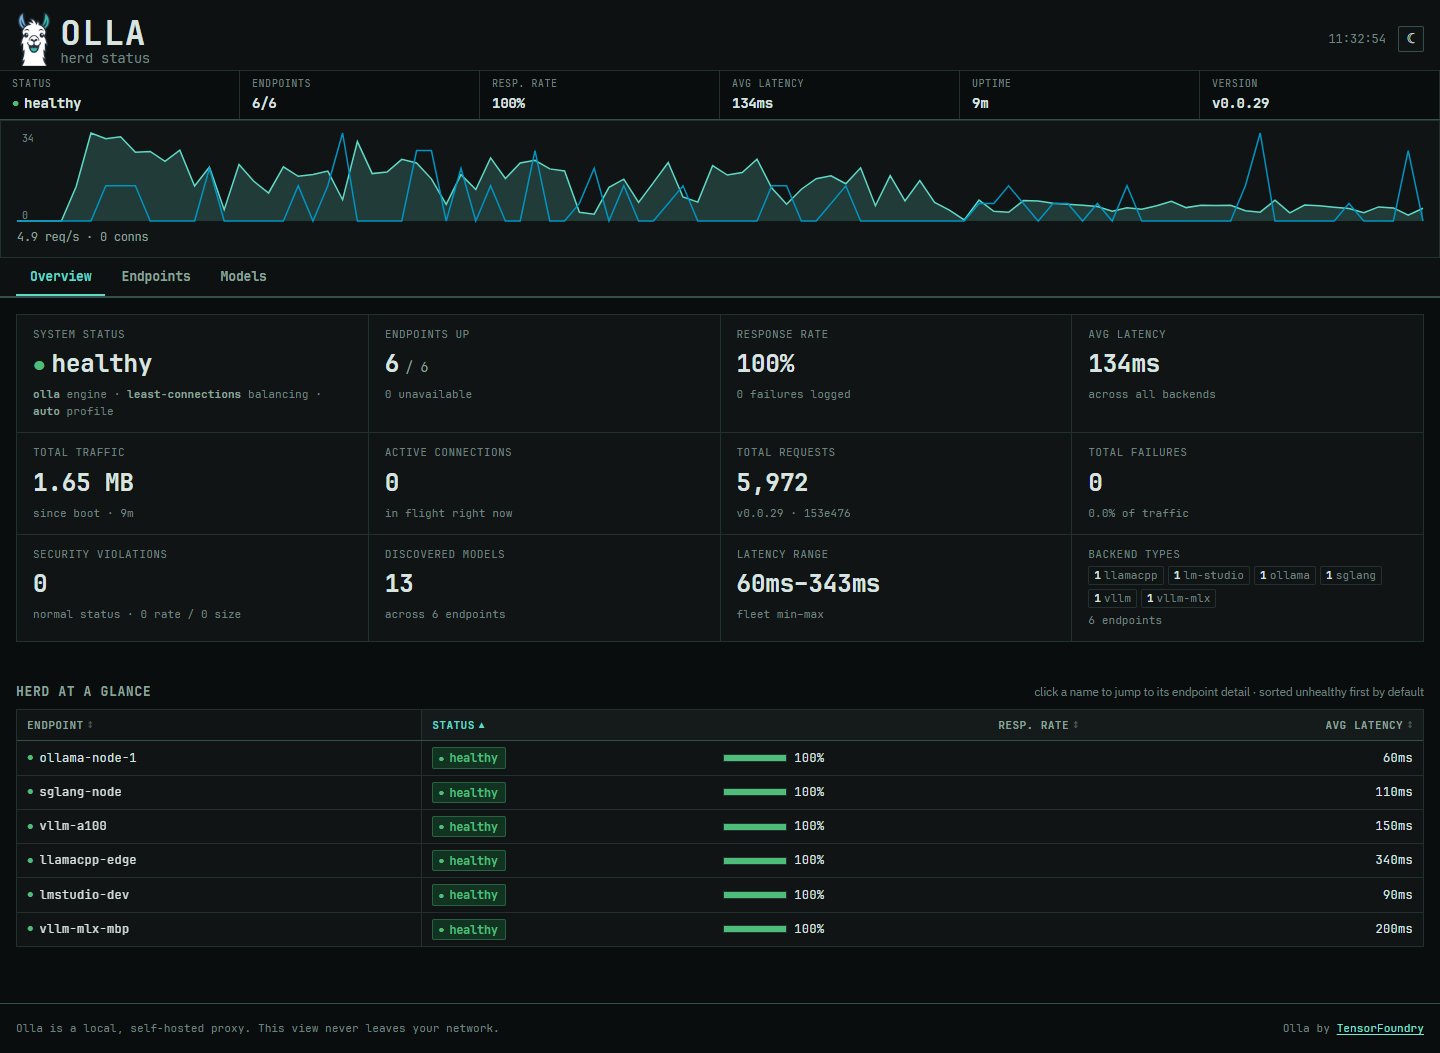
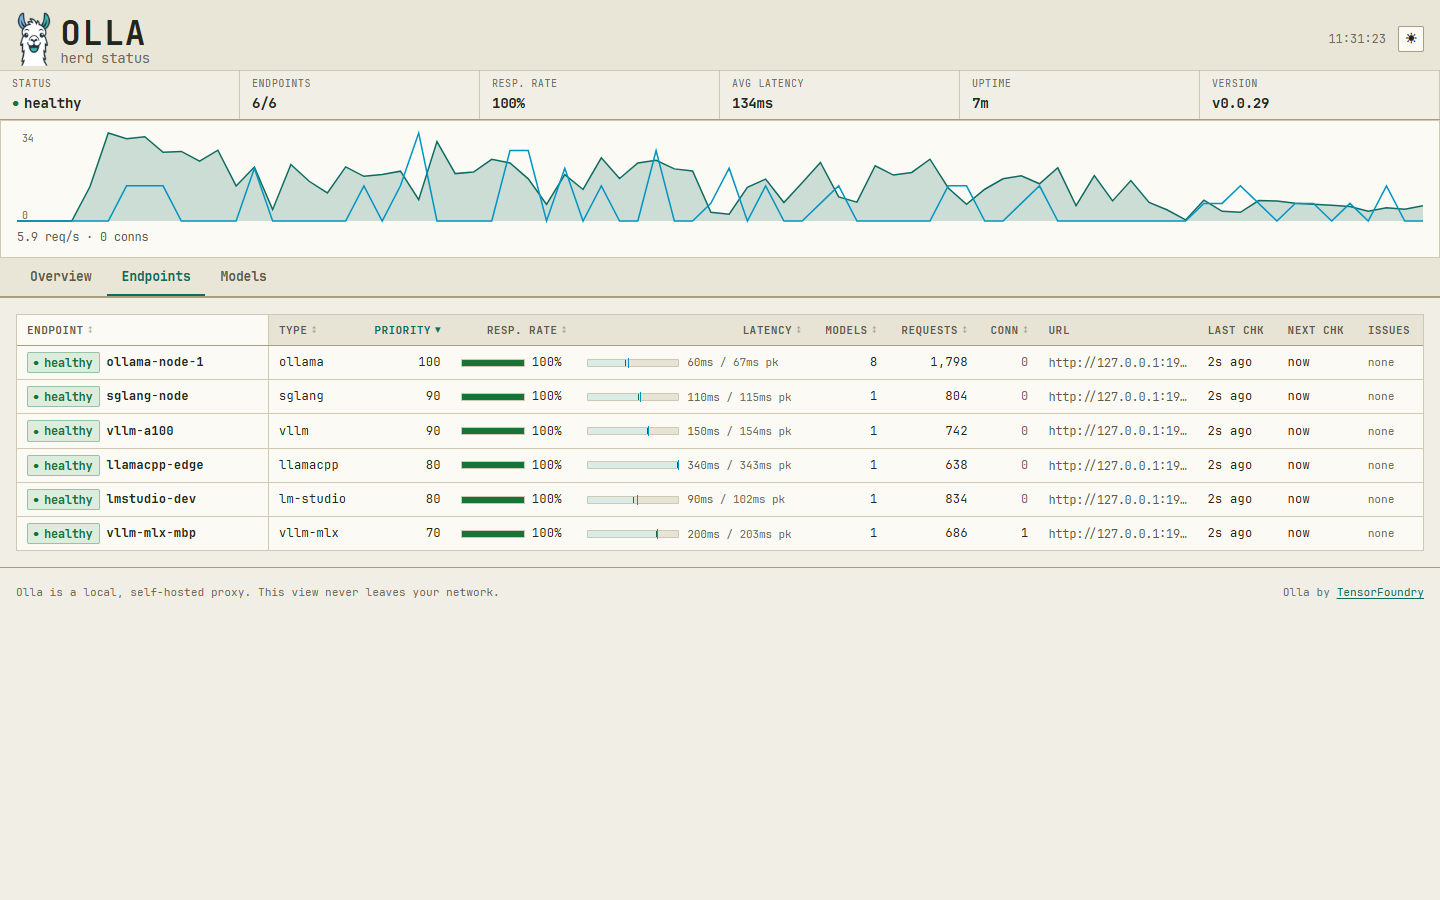
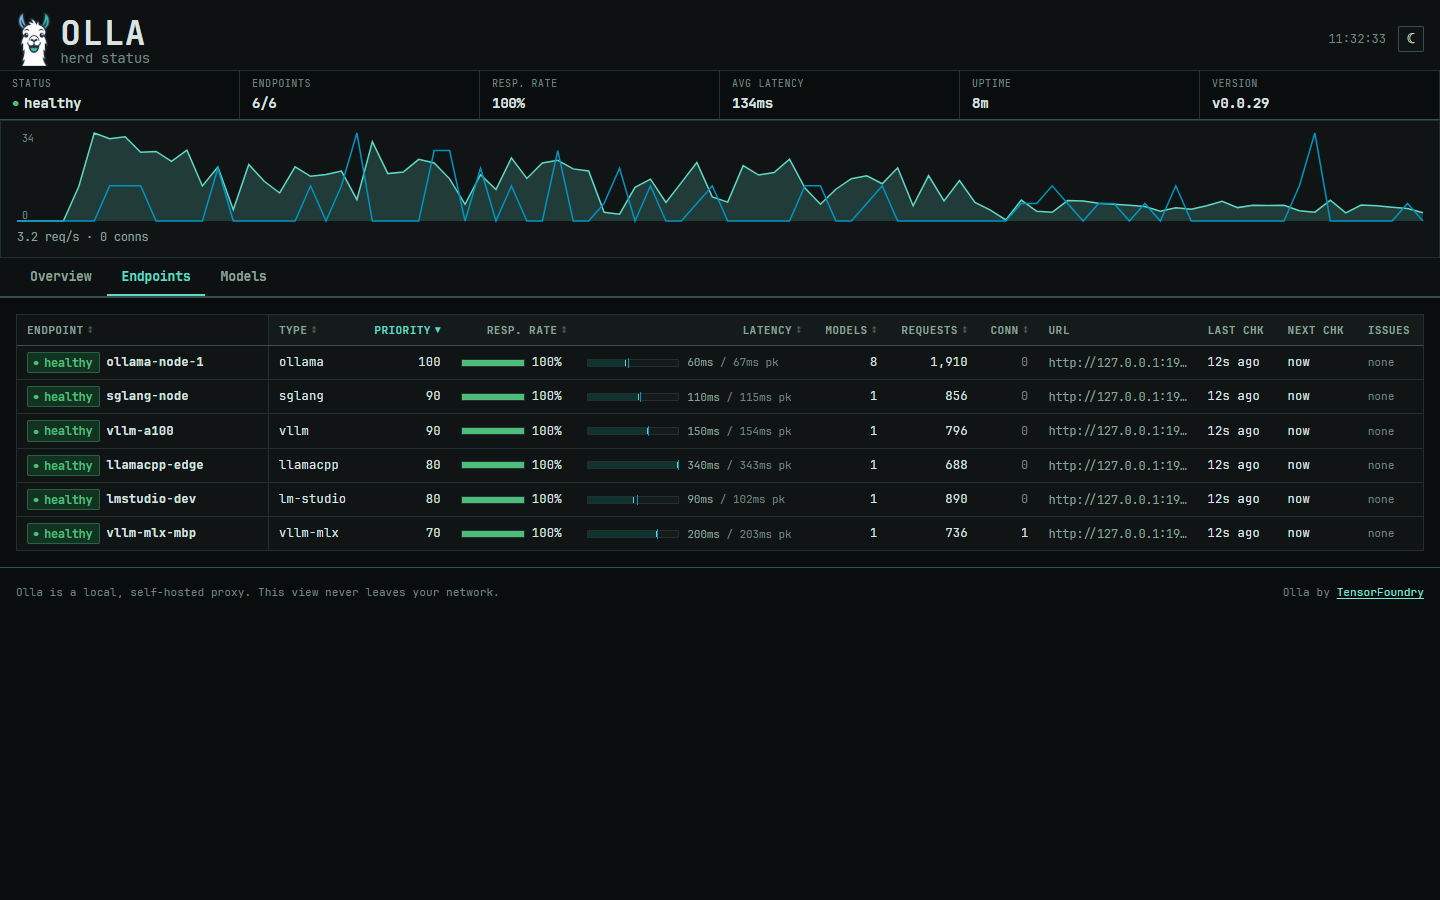
There are three views. Overview gives you system status, endpoints up, response rate, average latency and a live requests-per-second sparkline, plus a sortable table of every endpoint. Endpoints drills into per-endpoint health, priority, latency and model count. Models shows the discovered inventory grouped by family, with the endpoints hosting each one.
The dashboard has no authentication. Access is controlled by the new dashboard.access_policy block (allowed_cidrs and allowed_hosts), which is loopback-only by default. The published Docker
image pre-widens that to the RFC1918 ranges so docker run -p 40114:40114 gives you a working dashboard with no config mount, which also means anyone else on
that LAN can reach it through the published port. Read the Admin Dashboard docs for the full security model before you expose it.
What else changed
- Native
GET /internal/metricsin Prometheus text format, built from the same data as the status APIs, so core proxy monitoring needs no external exporter. Contributed by @Puupuls - Weak
ETags on the status endpoints, so polling clients get304s instead of re-fetching the whole payload - Sticky-session and routing decisions now appear in the structured "Request completed" log line, not just in response headers
- A request landing on an endpoint with an open circuit breaker now fails over to the next available endpoint instead of failing outright
- Strict routing no longer lets an unroutable
model_aliasesentry proxy to the wrong backend; it fails fast instead. Reported by @skaravos config/models.yamlnow actually parses. Invalid YAML meant it had never loaded on any install, silently falling back to embedded defaults. Reported by @billford- New
--validate-configflag checks configuration and provider profiles without starting the server - Endpoint URLs with embedded
user:pass@hostcredentials now fail startup instead of leaking into every status response, and statusid/urlfields are sanitised - Refreshed 2026 model catalogue: GPT-OSS, GLM, Kimi, Granite, Nemotron, EXAONE, Hunyuan, MiniMax, OLMo, InternLM, SmolLM, Command-R and Forge, plus MXFP4/NVFP4 quantisation
- Successful proxy requests log at
Infoagain, andlogging.levelfrom config is finally applied to the runtime logger
Breaking changes to check before upgrading: userinfo URLs now fail startup, status id/url are derived from a sanitised URL, a fresh boot with no
traffic no longer reports critical (use the new system.has_traffic flag), and a proxy request with zero healthy endpoints
returns 503 rather than 502.